Methods & Software
Hot-Spot Karten

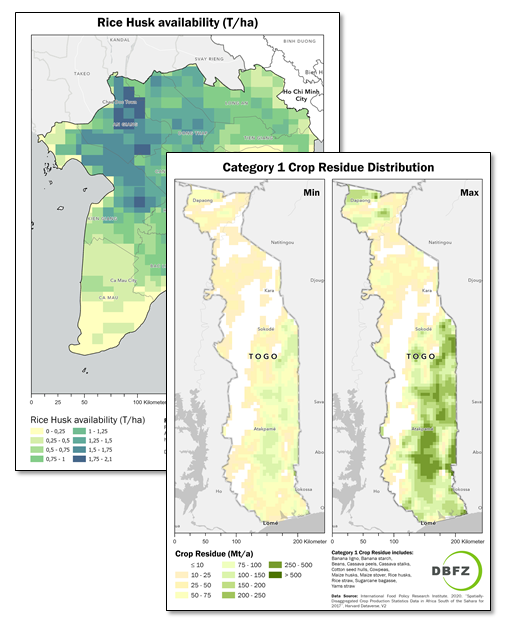
Distribution of available biomass resources at national or regional level. The maps can be based on global or regional data on agricultural production (e.g. IFPRI, GAEZ_2015+), Residue-to-Crop Ratios (RCR) and remote sensing data. Methods range from remote sensing classification algorithms to GIS analysis and data evaluation. GIS software is used to visualise and map resources and to show the focus of biomass availability.
Example: In a project in southern Vietnam, we mapped the extent of rice cultivation to identify regions where the availability of rice husks is highest. This information can be used as a decision support tool to identify suitable locations for the construction of an energy and material processing plant.
Dashboards and Webmaps
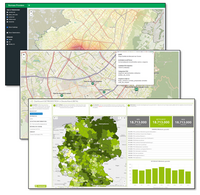
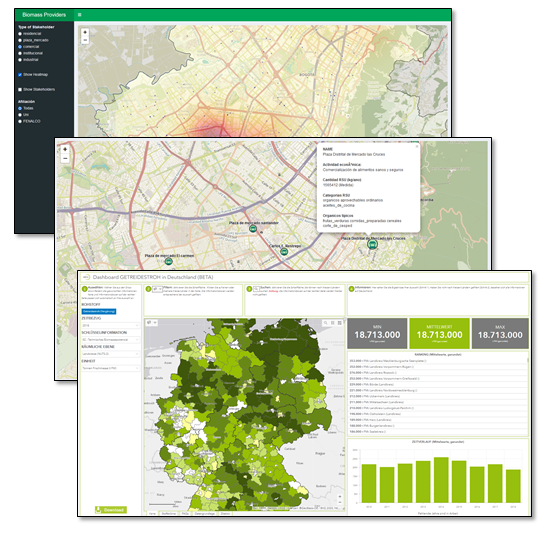
Stakeholder mapping, heat maps, visualisation and categorisation of waste and biomass suppliers. The Working Group Resources has produced dashboards and web maps in a variety of contexts. The aim is to visualise resource availability in an interactive web environment that allows users to create specific subsets of data for further analysis. For example, resource availability of point sources can be mapped (e.g. using heat maps) and material flows can be visualised using web mapping and dashboard tools such as ArcGIS online, Leaflet or Shiny.
Example: In a project in Bogotá, Colombia, we mapped the different actors and the waste categories and quantities they generate, and based on this information developed a web map that visualises the spatial availability of organic waste from different sectors (commercial, industrial, household, etc.).
Stakeholder Mapping

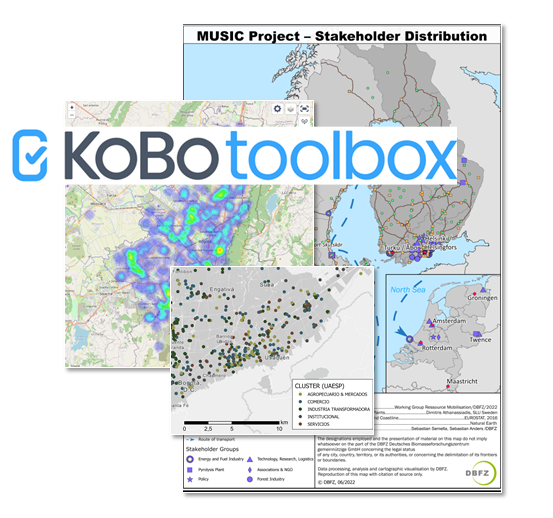
Visualising the distribution and allocation of information among the actors involved in a project. This often involves representative surveys to collect data. The resulting information (e.g. type and quantity of municipal waste) is assigned to stakeholders and mapped. This enables the presentation of categorical information and quantities and relate them to stakeholders.
Technology Suitability Maps

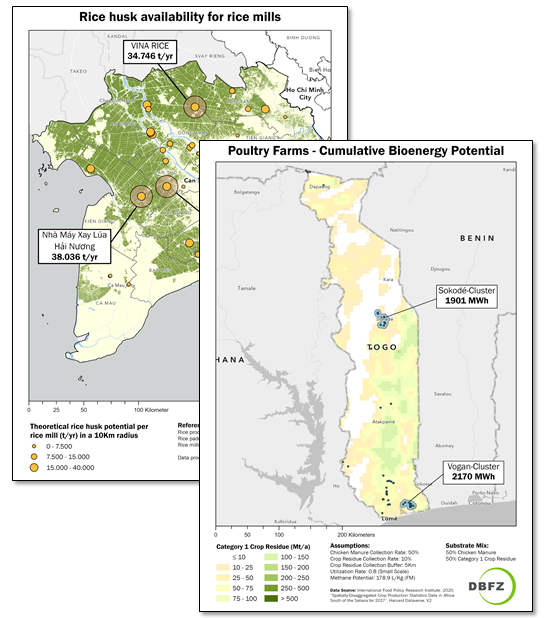
Spatial data, such as the distribution of cropland or transport infrastructure and the technological parameters of energy producers can be used to map the regional suitability of bioenergy crops and their potential energy yields. Various spatial and geostatistical analyses are performed and then visualised using GIS software.
Example: In a project in Togo, we mapped the theoretical biomass potential from agricultural residues and linked this information with the site-specific production of biogenic residues and waste for specific actors (e.g. livestock farms, food processing industries) to determine their potential for biogas production.
Geographical Information Systems (GIS)


Using custom methods and a variety of (geo-)datasets, the Working Group Resources develops estimates of biomass production at different spatial scales and in different geographical contexts. The main tools used are ArcGIS Pro and QGIS. The results of these assessments are static and dynamic digital map products that are made available to the public in reports and on online portals.
Field data acquisition and need assessments with KoboToolbox


Competence in using the KoBo-Toolbox survey tool enables our working group to create customised digital questionnaires that can be used in various areas, including surveying stakeholders in agriculture and food processing. We also use KoBo-Toolbox to conduct surveys to determine the level of knowledge and expectations of our course participants and to adapt our course offerings to meet their needs. See also: https://www.kobotoolbox.org/
Statistical Programming in R


Working with R is a central part of the working group's activities, as it automates complex data aggregation and statistical analysis of different data sets. The use of scripts to create evaluation algorithms allows a transparent representation of data analysis and efficient processing of complex tasks, such as the calculation of cost-benefit curves or regional biomass potential. Of particular interest is the synergy between data preparation and the use of GIS cartographic capabilities to present results.